This is a graph showing COVID-19 growth.
Puerto Rico
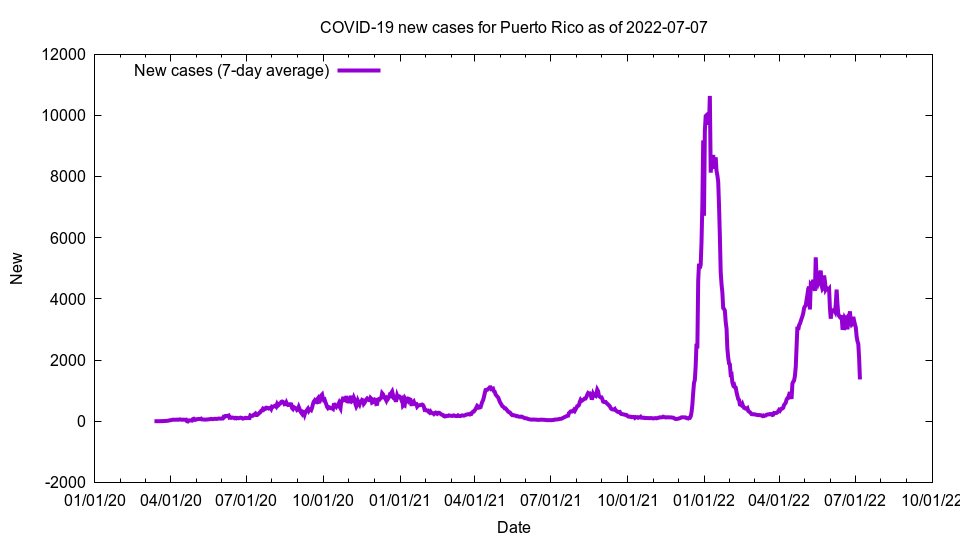
This image shows new cases for Puerto Rico as of 2022-07-07
Cases: 816,383
New cases (7-day average): 1,364.71
Growth: 0.17%
Doubling days (calculated): > 100
Doubling days (actual): 176.00
The above graph shows new cases, i.e. the number of new cases we have seen.
Cases is total COVID-19 cases; cases per 100,000 is cases per 100,000 people; cases 14-day per 100k is the total number of cases over the last 14 days, added together, then multiplied by 100,000, then divided by the population. New cases is the number of cases we have had per day on average over the last seven days. Growth is the increase in cases compared to the previous number of cases; the number is a 7-day average. Doubling days is the number of days it will take for cases to double at the current growth rate (calculated), or the number of days in the past we have had half the current number of cases (actual).
County list
Adjuntas, Puerto Rico Growth: 0.22%Aguada, Puerto Rico Growth: 0.16%
Aguadilla, Puerto Rico Growth: 0.11%
Aguas Buenas, Puerto Rico Growth: 0.21%
Aibonito, Puerto Rico Growth: 0.19%
Anasco, Puerto Rico Growth: 0.17%
Arecibo, Puerto Rico Growth: 0.16%
Arroyo, Puerto Rico Growth: 0.19%
Barceloneta, Puerto Rico Growth: 0.14%
Barranquitas, Puerto Rico Growth: 0.15%
Bayamon, Puerto Rico Growth: 0.16%
Cabo Rojo, Puerto Rico Growth: 0.19%
Caguas, Puerto Rico Growth: 0.20%
Camuy, Puerto Rico Growth: 0.23%
Canovanas, Puerto Rico Growth: 0.25%
Carolina, Puerto Rico Growth: 0.17%
Catano, Puerto Rico Growth: 0.15%
Cayey, Puerto Rico Growth: 0.19%
Ceiba, Puerto Rico Growth: 0.18%
Ciales, Puerto Rico Growth: 0.14%
Cidra, Puerto Rico Growth: 0.28%
Coamo, Puerto Rico Growth: 0.18%
Comerio, Puerto Rico Growth: 0.20%
Corozal, Puerto Rico Growth: 0.11%
Culebra, Puerto Rico Growth: 0.08%
Dorado, Puerto Rico Growth: 0.13%
Fajardo, Puerto Rico Growth: 0.12%
Florida, Puerto Rico Growth: 0.16%
Guanica, Puerto Rico Growth: 0.31%
Guayama, Puerto Rico Growth: 0.24%
Guayanilla, Puerto Rico Growth: 0.10%
Guaynabo, Puerto Rico Growth: 0.14%
Gurabo, Puerto Rico Growth: 0.17%
Hatillo, Puerto Rico Growth: 0.21%
Hormigueros, Puerto Rico Growth: 0.23%
Humacao, Puerto Rico Growth: 0.22%
Isabela, Puerto Rico Growth: 0.13%
Jayuya, Puerto Rico Growth: 0.12%
Juana Diaz, Puerto Rico Growth: 0.19%
Juncos, Puerto Rico Growth: 0.23%
Lajas, Puerto Rico Growth: 0.28%
Lares, Puerto Rico Growth: 0.29%
Las Marias, Puerto Rico Growth: 0.34%
Las Piedras, Puerto Rico Growth: 0.26%
Loiza, Puerto Rico Growth: 0.11%
Luquillo, Puerto Rico Growth: 0.17%
Manati, Puerto Rico Growth: 0.13%
Maricao, Puerto Rico Growth: 0.24%
Maunabo, Puerto Rico Growth: 0.26%
Mayaguez, Puerto Rico Growth: 0.20%
Moca, Puerto Rico Growth: 0.24%
Morovis, Puerto Rico Growth: 0.15%
Naguabo, Puerto Rico Growth: 0.27%
Naranjito, Puerto Rico Growth: 0.12%
Orocovis, Puerto Rico Growth: 0.18%
Patillas, Puerto Rico Growth: 0.19%
Penuelas, Puerto Rico Growth: 0.09%
Ponce, Puerto Rico Growth: 0.15%
Quebradillas, Puerto Rico Growth: 0.19%
Rincon, Puerto Rico Growth: 0.15%
Rio Grande, Puerto Rico Growth: 0.18%
Sabana Grande, Puerto Rico Growth: 0.14%
Salinas, Puerto Rico Growth: 0.13%
San German, Puerto Rico Growth: 0.13%
San Juan, Puerto Rico Growth: 0.12%
San Lorenzo, Puerto Rico Growth: 0.20%
San Sebastian, Puerto Rico Growth: 0.19%
Santa Isabel, Puerto Rico Growth: 0.21%
Toa Alta, Puerto Rico Growth: 0.12%
Toa Baja, Puerto Rico Growth: 0.16%
Trujillo Alto, Puerto Rico Growth: 0.15%
Unknown, Puerto Rico Growth: 0.15%
Utuado, Puerto Rico Growth: 0.14%
Vega Alta, Puerto Rico Growth: 0.14%
Vega Baja, Puerto Rico Growth: 0.16%
Vieques, Puerto Rico Growth: 0.31%
Villalba, Puerto Rico Growth: 0.06%
Yabucoa, Puerto Rico Growth: 0.26%
Yauco, Puerto Rico Growth: 0.16%
Return to USA -
Return to top -
Deaths for this state
The data comes from The New York Times and the code to generate these pages is open source and available on GitHub. The number of actual COVID-19 cases and deaths are almost certainly higher than these figures.